html5中canvas图表实现柱状图的示例
时间:2017-12-05执行动画也没啥好说的,里面就是个自执行闭包函数。动画原理就是给y轴依次累加速度值vy。但记得当队列执行完动画后,要停止它,所以有个isStop的标志,每次执行完队列的时候就判断。
animate(){
    var that=this,
        ctx=this.ctx,
        isStop=true;
    (function run(){
        isStop=true;
        for(var i=0,item;i<that.animateArr.length;i++){
            item=that.animateArr[i];
            if(item.y-item.h>=0.1){
                item.y=item.h;
            } else {
                item.y+=item.vy;
            }
            if(item.y<item.h){
                ctx.save();
                // ctx.translate(that.padding+item.x,that.H-that.padding);
                ctx.fillStyle=item.color;
                ctx.fillRect(that.padding+item.x,that.H-that.padding-item.y,item.w,item.y);
                ctx.restore();
                isStop=false;
            }
        }
        if(isStop)return;
        requestAnimationFrame(run);
    }())
}
绑定事件
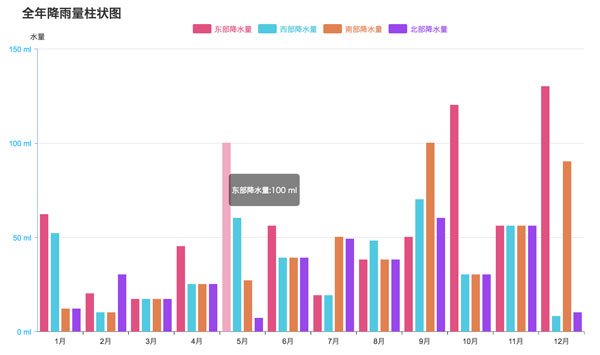
事件一:mousemove的时候,看看鼠标位置是不是处于分组标签还是数据项上,绘制路径后调用isPointInPath(x,y),true则canvas.style.cursor='pointer';如果是数据项的话,还要给把该柱形重新绘制,设置透明度,区分出来。还需要把内容显示出来,这里是一个相对父容器container为绝对定位的div,初始化的时候已经建立为tip属性了。我们把显示部分封装成showInfo方法。
事件二:mousedown的时候,判断鼠标点击哪个分组标签,然后设置对应分组数据series中的hide属性,如果是true,表示不显示该项,然后调用draw方法,重写渲染绘制,执行动画。
bindEvent(){
        var that=this,
            canvas=this.canvas,
            ctx=this.ctx;
        this.canvas.addEventListener('mousemove',function(e){
            var isLegend=false;
                // pos=WindowToCanvas(canvas,e.clientX,e.clientY);
            var box=canvas.getBoundingClientRect();
            var pos = {
                x:e.clientX-box.left,
                y:e.clientY-box.top
            };
            // 分组标签
            for(var i=0,item,len=that.legend.length;i<len;i++){
                item=that.legend[i];
                ctx.save();
                roundRect(ctx,item.x,item.y,item.w,item.h,item.r);
                // 因为缩小了一倍,所以坐标要*2
                if(ctx.isPointInPath(pos.x*2,pos.y*2)){
                    canvas.style.cursor='pointer';
                    ctx.restore();
                    isLegend=true;
                    break;
                }
                canvas.style.cursor='default';
                ctx.restore();
            }

            if(isLegend) return;
            //选择数据项
            for(var i=0,item,len=that.animateArr.length;i<len;i++){
                item=that.animateArr[i];
                ctx.save();
                ctx.fillStyle=item.color;
                ctx.beginPath();
                ctx.rect(that.padding+item.x,that.H-that.padding-item.h,item.w,item.h);
                if(ctx.isPointInPath(pos.x*2,pos.y*2)){
                    //清空后再重新绘制透明度为0.5的图形
                    ctx.clearRect(that.padding+item.x,that.H-that.padding-item.h,item.w,item.h);
                    ctx.globalAlpha=0.5;
                    ctx.fill();
                    canvas.style.cursor='pointer';
                    that.showInfo(pos,item);
                    ctx.restore();
                    break;
                }
                canvas.style.cursor='default';
                that.tip.style.display='none';
                ctx.globalAlpha=1;
                ctx.fill();
                ctx.restore();
            }

        },false);

        this.canvas.addEventListener('mousedown',function(e){
            e.preventDefault();
            var box=canvas.getBoundingClientRect();
            var pos = {
                x:e.clientX-box.left,
                y:e.clientY-box.top
            };
            for(var i=0,item,len=that.legend.length;i<len;i++){
                item=that.legend[i];
                roundRect(ctx,item.x,item.y,item.w,item.h,item.r);
                // 因为缩小了一倍,所以坐标要*2
                if(ctx.isPointInPath(pos.x*2,pos.y*2)){
                    that.series[i].hide=!that.series[i].hide;
                    that.animateArr.length=0;
                    that.draw();
                    break;
                }
            }

        },false);
    }
    //显示数据
    showInfo(pos,obj){
        var txt=this.yAxis.formatter?this.yAxis.formatter.replace('{value}',obj.num):obj.num;
        var box=this.canvas.getBoundingClientRect();
        var con=this.container.getBoundingClientRect();
        this.tip.innerHTML = '<p>'+obj.name+':'+txt+'</p>';
        this.tip.style.left=(pos.x+(box.left-con.left)+10)+'px';
        this.tip.style.top=(pos.y+(box.top-con.top)+10)+'px';
        this.tip.style.display='block';
    }
总结
 有关HTML5页面在iPhoneX适配问题这篇文章主要介绍了有关HTML5页面在iPhoneX适配问题,需要的朋友可以参考下
 html5中canvas图表实现柱状图的示例本篇文章主要介绍了html5中canvas图表实现柱状图的示例,本文使用canvas来实现一个图表,小编觉得挺不错的,现在分享给大家