html5中canvas图表实现柱状图的示例
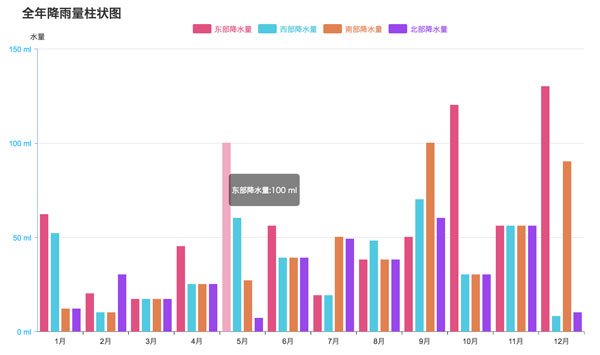
时间:2017-12-05因为数据项需要后续执行动画和鼠标滑过的时候显示内容,所以把它放进动画队列animateArr中。这里要把分组数据展开,把之前的两次嵌套的数组转为一层,并计算好每个数据项的属性,比如名称,x坐标,y坐标,宽度,速度,颜色。数据组织完毕后,接着执行动画。
showData(xl,xs,max){
    //画数据
    var that=this,
        ctx=this.ctx,
        ydis=this.H-this.padding*2-this.paddingTop,
        sl=this.series.filter(s=>!s.hide).length,
        sp=Math.max(Math.pow(10-sl,2)/3-4,5),
        w=(xs-sp*(sl+1))/sl,
        h,x,index=0;
    that.animateArr.length=0;
    // 展开数据项,填入动画队列
    for(var i=0,item,len=this.series.length;i<len;i++){
        item=this.series[i];
        if(item.hide)continue;
        item.data.slice(0,xl).forEach((d,j)=>{
            h=d/max*ydis;
            x=xs*j+w*index+sp*(index+1);
            that.animateArr.push({
                index:i,
                name:item.name,
                num:d,
                x:Math.round(x),
                y:1,
                w:Math.round(w),
                h:Math.floor(h+2),
                vy:Math.max(300,Math.floor(h*2))/100,
                color:item.color
            });
        });
        index++;
    }
    this.animate();
}
执行动画
 有关HTML5页面在iPhoneX适配问题这篇文章主要介绍了有关HTML5页面在iPhoneX适配问题,需要的朋友可以参考下
 html5中canvas图表实现柱状图的示例本篇文章主要介绍了html5中canvas图表实现柱状图的示例,本文使用canvas来实现一个图表,小编觉得挺不错的,现在分享给大家