详解使用HTML5 Canvas创建动态粒子网格动画
时间:2017-04-08需要指出的是:如果添加过多的点和/或过多的连接距离(连接距离会创建过多的线条),动画也会扛不住。当视口变窄时最好降低粒子的运动速度:粒子的尺寸越小,在愈加狭窄空间内的移动速度貌似会越快。
显示整段代码:
<!DOCTYPE html>
<html lang="en">
<head>
    <meta charset="UTF-8">
    <title>canvas粒子动画</title>
    <style>
        #canvas{
            position: absolute;
            display: block;
            left:0;
            top:0;
            background: #0f0f0f;
            z-index: -1;
        }
    </style>
</head>
<body>
<canvas id="canvas"></canvas>
<script>
    var canvas = document.getElementById("canvas");
    var ctx = canvas.getContext("2d");
    var opt = {
        particleAmount: 50,     //粒子个数
        defaultSpeed: 1,        //粒子运动速度
        variantSpeed: 1,        //粒子运动速度的变量
        particleColor: "rgb(32,245,245)",       //粒子的颜色
        lineColor:"rgb(32,245,245)",            //网格连线的颜色
        defaultRadius: 2,           //粒子半径
        variantRadius: 2,           //粒子半径的变量
        minDistance: 200            //粒子之间连线的最小距离
    };
    var line = opt.lineColor.match(/\d+/g);
    console.log(line);
    var particle = [], w,h;
    var delay = 200,tid;
    init();
    window.addEventListener("resize",function(){
        winResize()
    },false);

    function winResize(){
        clearTimeout(tid);
        tid = setTimeout(function(){
            getSize();
        },delay)
    }

    function init(){
        getSize();
        for(let i = 0;i<opt.particleAmount; i++){
            particle.push(new Partical());
        }
        loop();
    }

    function loop(){
        ctx.clearRect(0,0,w,h);
        for(let i = 0;i<particle.length; i++){
            particle[i].update();
            particle[i].draw();
        }
        for(let i = 0;i<particle.length; i++){
            linePoint(particle[i],particle)
        }
        window.requestAnimationFrame(loop);
    }

    function linePoint(point,hub){
        for(let i = 0;i<hub.length;i++){
            let distance = getDistance(point,hub[i]);
            let opacity = 1 -distance/opt.minDistance;
            if(opacity > 0){
                ctx.lineWidth = 0.5;
                ctx.strokeStyle = "rgba("+line[0]+","+line[1]+","+line[2]+","+opacity+")";
                ctx.beginPath();
                ctx.moveTo(point.x,point.y);
                ctx.lineTo(hub[i].x,hub[i].y);
                ctx.closePath();
                ctx.stroke();
            }
        }
    }

    function getDistance(point1,point2){
        return Math.sqrt(Math.pow(point1.x-point2.x,2) + Math.pow(point1.y - point2.y ,2));
    }

    function getSize(){
        w = canvas.width = window.innerWidth;
        h = canvas.height = window.innerHeight;
    }
    function Partical(){
        this.x = Math.random()*w;           //粒子的x轴坐标
        this.y = Math.random()*h;           //粒子的y轴坐标
        this.speed = opt.defaultSpeed + opt.variantSpeed*Math.random();     //粒子的运动速度
        this.directionAngle = Math.floor(Math.random()*360);                //粒子运动的方向
        this.color = opt.particleColor ;                                    //粒子的颜色
        this.radius = opt.defaultRadius+Math.random()*opt.variantRadius;    //粒子的半径大小
        this.vector = {
            x:this.speed * Math.cos(this.directionAngle),       //粒子在x轴的速度
            y:this.speed * Math.sin(this.directionAngle)        //粒子在y轴的速度
        }
        this.update = function(){                   //粒子的更新函数
            this.border();                           //判断粒子是否到了边界
            this.x += this.vector.x;                //粒子下一时刻在x轴的坐标
            this.y += this.vector.y;                //粒子下一时刻在y轴的坐标
        }
        this.border = function(){               //判断粒子是都到达边界
            if(this.x >= w || this.x<= 0){      //如果到达左右边界,就让x轴的速度变为原来的负数
                this.vector.x *= -1;
            }
            if(this.y >= h || this.y <= 0){     //如果到达上下边界,就让y轴的速度变为原来的负数
                this.vector.y *= -1;
            }
            if(this.x > w){                     //下面是改变浏览器窗口大小时的操作,改变窗口大小后有的粒子会被隐藏,让他显示出来即可
                this.x = w;
            }
            if(this.y > h){
                this.y = h;
            }
            if(this.x < 0){
                this.x = 0;
            }
            if(this.y < 0){
                this.y = 0;
            }
        }
        this.draw = function(){                 //绘制粒子的函数
            ctx.beginPath();
            ctx.arc(this.x, this.y, this.radius ,0 ,Math.PI * 2);
            ctx.closePath();
            ctx.fillStyle = this.color;
            ctx.fill();
        }
    }
</script>
</body>
</html>
以上就是本文的全部内容,希望对大家的学习有所帮助,也希望大家多多支持。
相关文章
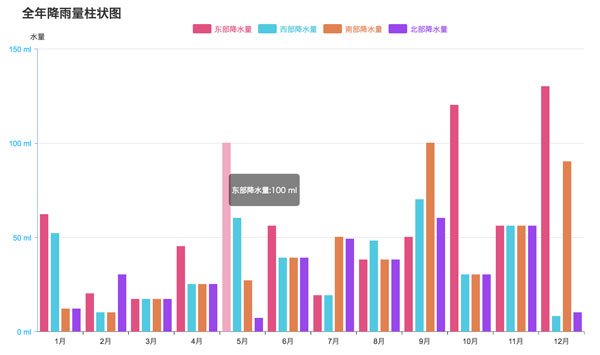 html5中canvas图表实现柱状图的示例本篇文章主要介绍了html5中canvas图表实现柱状图的示例,本文使用canvas来实现一个图表,小编觉得挺不错的,现在分享
 canvas 实现 github404动态效果的示例代码本篇文章主要介绍了canvas 实现 github404动态效果的示例代码,小编觉得挺不错的,现在分享给大家,也给大家做个参考
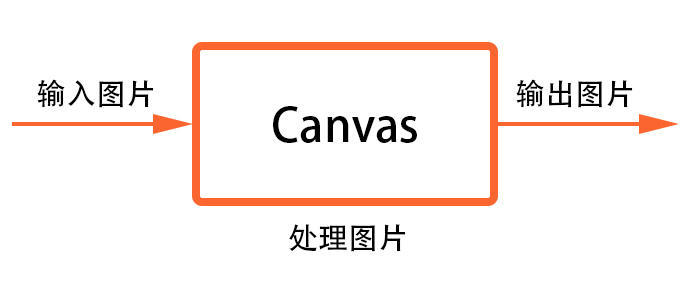 教你使用Canvas处理图片的方法本篇文章主要介绍了教你使用Canvas处理图片的方法,小编觉得挺不错的,现在分享给大家,也给大家做个参考。一起
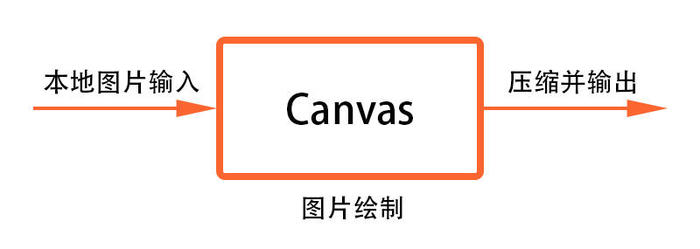 Canvas与图片压缩的示例代码本篇文章主要介绍了Canvas与图片压缩的示例代码,小编觉得挺不错的,现在分享给大家,也给大家做个参考。一起跟
 基于HTML5 Canvas的3D动态Chart图表的示例这篇文章主要介绍了基于HTML5 Canvas的3D动态Chart图表的示例,小编觉得挺不错的,现在分享给大家,也给大家做个参考。
 canvas之自定义头像功能实现代码示例本篇文章主要介绍了canvas之自定义头像功能实现代码示例,具有一定的参考价值,感兴趣的小伙伴们可以参考一下
 有关HTML5页面在iPhoneX适配问题这篇文章主要介绍了有关HTML5页面在iPhoneX适配问题,需要的朋友可以参考下